gopherblue
Straight Flush
If only there was a tool for tracking this.
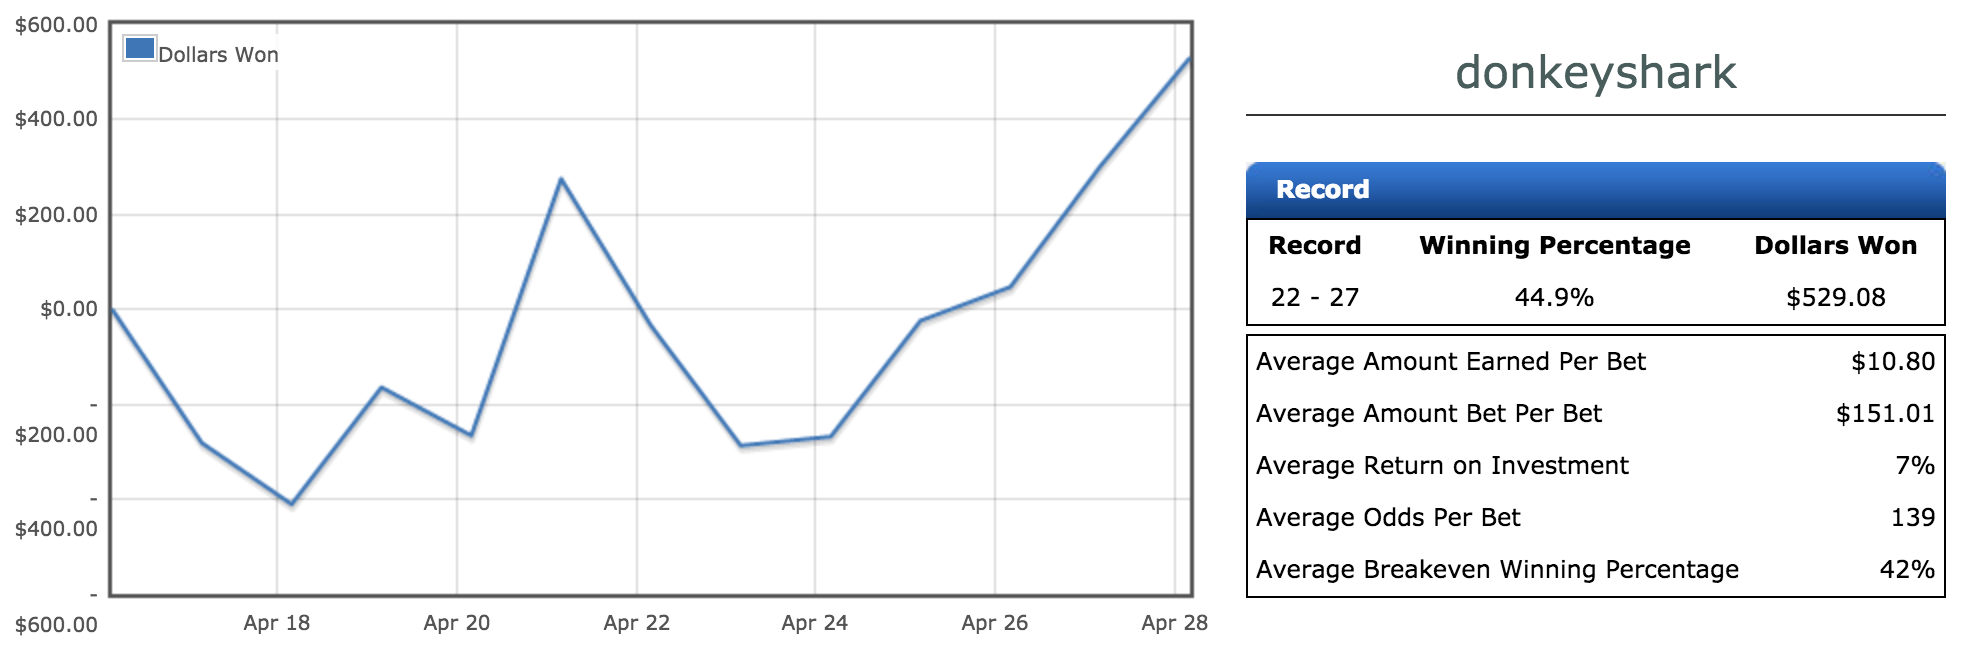
So, for my understanding and using the games on the 27th as an example, he won;
Miami +165
Philly +182
Houston +122
for a total of $469
He lost 3 games, which only cost him $100 a piece since he took the underdogs, so his profit was $169 for the 27th?
Is this right?
You know what would make this more exciting for some of us to follow? Posting results. Not just the game results, but the money results.
I'm not interested in the baseball, but curious about the performance of your model.
I'm not interested enough to do the math myself though.
Today's games so far...
Oakland +117
Atlanta +177
April 29th games
San Diego +165
Colorado +125
April 30th games so far
Minnesota +109
Seattle -104
Adding in a lot of games for today... I'm pretty sure this is the most games I've ever bet in one day before.
Colorado +151
Cincinnati +180
LA Angels +107
San Diego +160
San Francisco +165
Washington +114
Milwaukee +106
") Although, I did start the season off with a slump, so there's that...
Although, I did start the season off with a slump, so there's that...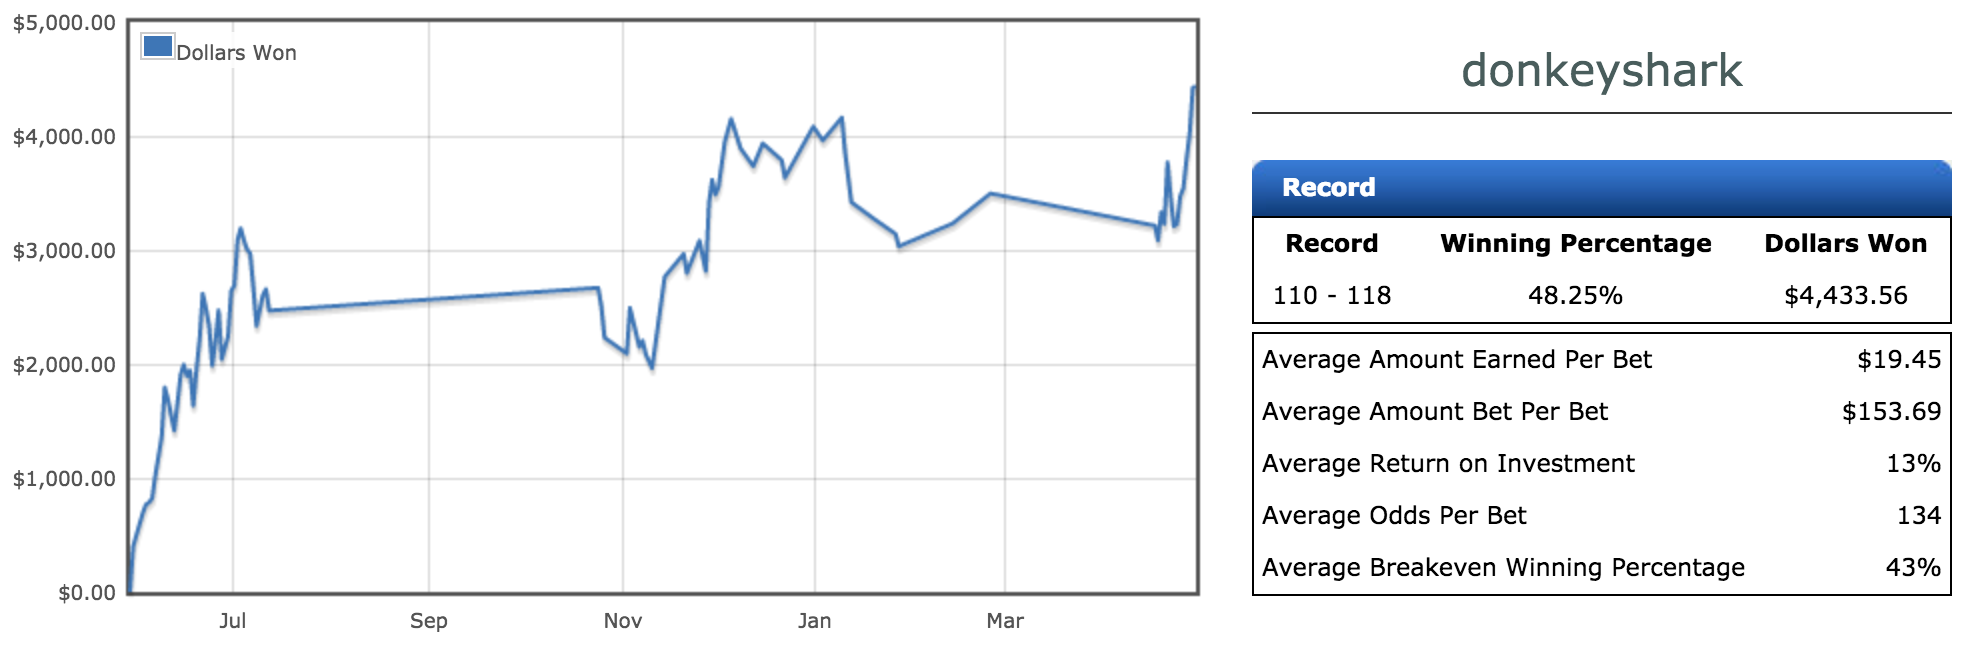
May 1st games are
Baltimore +115
NY Yankees +145
LA Angels +115
Tampa Bay +107
May 1st games are
Baltimore +115
NY Yankees +145
LA Angels +115
Tampa Bay +107
Minnesota +165
Atlanta +181 (previous post said this was +180, but it was actually +181)
May 3rd games
NY Yankees +110
Minnesota +145
Milwaukee +112
Atlanta +190
Philadelphia +135
OK, gonna bet a few more games tomorrow, but I'm jumping on the early line for the A's game for tomorrow (May 4). I'll post the others when I place my bets. I'll probably be betting on Milwaukee but that line is moving fast, and in my favor, so I'm going to wait to let them push the line more before I take it.
May 4 bets:
Oakland +110
OK, the lines I got for today's games are:
Oakland +110
Atlanta +175
Milwaukee +130
Kansas City +135
NY Yankees +121
This could be a bad day...
No games yet for May 5th. I have two games on my radar, San Diego and Philadelphia, but so far, both are a no go.
It's official. No games today
haha. Would have lost them both. Glad I held off on the early lines.Just curious and feel free to ignore. But just wondering how big of a bankroll you started out with?